The 3 types of spreadsheets
We have been taking quite a deep dive into the world of spreadsheets lately. We have analyzed tens of thousands of spreadsheets “from the wild” and done various qualitative research on spreadsheet usage.
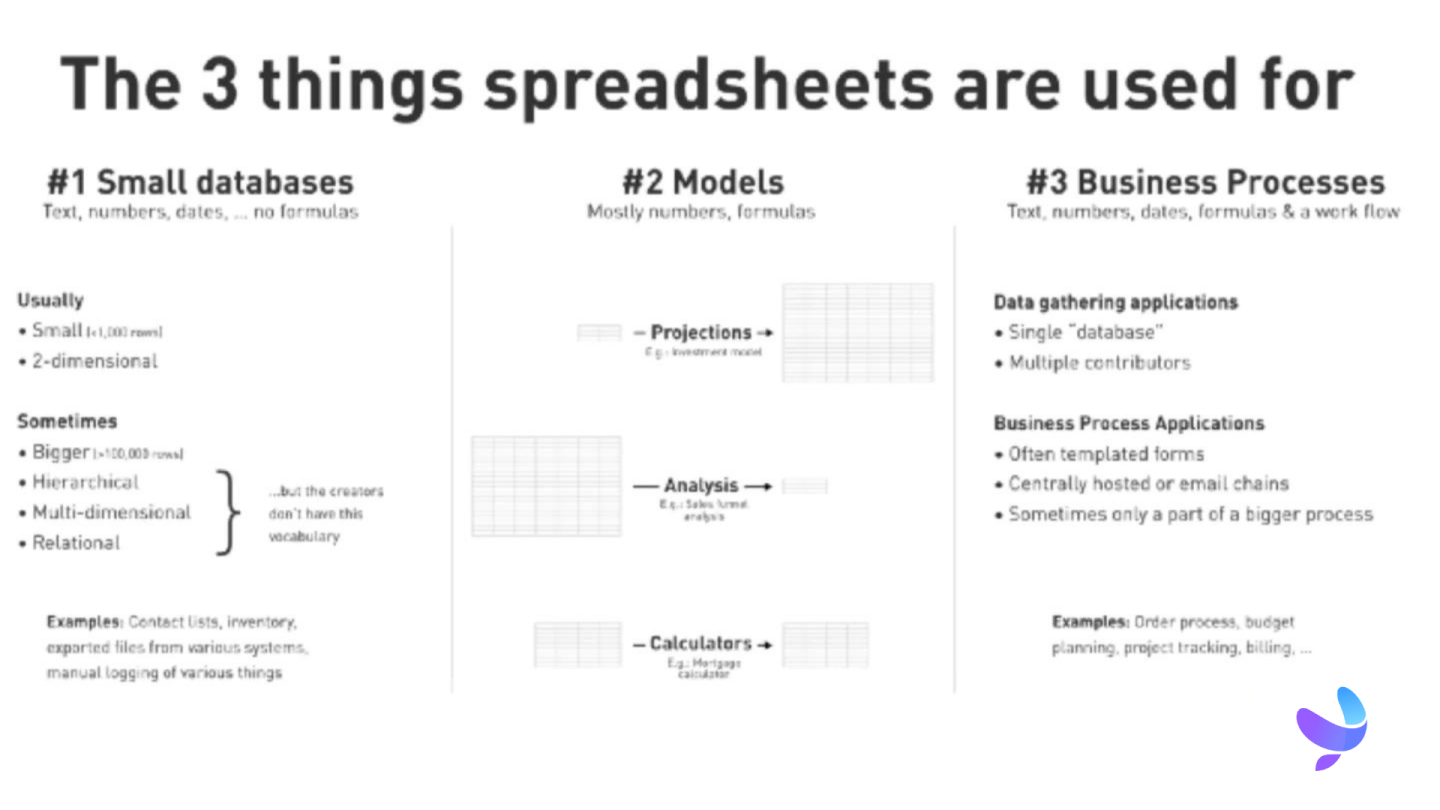
Through this, we’ve come to the conclusion that pretty much every spreadsheet in the world is used for one of three things:
Small databases
Models
Business Processes
Let’s take a little bit deeper dive into each of these categories.
Small databases
Spreadsheet software is the first thing a regular user fires up whenever any data needs to be collected: Contact lists, inventory, logging custom things — the spreadsheet is the natural choice.
These files will usually not have so much as a single formula in them, and the content is often text heavy compared to other spreadsheets. These files are usually small (less than 1,000 rows of data) and contain 2-dimensional data.
Occasionally however — you will see much more complicated data structures in user-created spreadsheets :
multi-dimensional: multiple headers in a table usually add a dimension although obviously still represented in the 2-dimensional grid(a simple intro to multi-dimensional data can be found)
hierarchical: some rows in a table are of a lower level and roll up to higher level rows
even relational: data on one sheet refers to details on another, or additional rows list children (sometimes literally) of a parent.
But you can still assume that the creators of these sheets will rarely have any of that vocabulary. In other words: Many people are capable of fairly complicated data modeling, without knowing any of the data-modeling jargon. We believe this is an important observation.
A separate — and very common —sub-category of spreadsheet databases are files that are exported from other systems. These can in fact get quite big (often >100,000 rows) and are put in Excel files either to do analysis on them (see next category) or to transport them from one system to another, e.g. from a transactional system to a Business Intelligence system.
Models
The second category is what spreadsheets were built for: models. These files are usually number-heavy and their defining characteristic is that they have formulas in them. Users are calculating something.
We have furthermore identified three sub-categories here:
Projections: Where a lot of data is generated from a relatively small set of input parameters. A common example would be a financial projection based on a set of assumptions (often 1000s of numbers generated from <20 assumptions).
Analysis: Where a small set of data is calculated from a large set of data, often exported some other system. A typical example would be to calculate average customer spend based on age-group on data exported from a retail system. In this case the spreadsheet is competing directly against purpose-built BI systems, and — in many respects — winning.
Calculators: This is the most diverse sub-category. Here you’ll find spreadsheets where people are performing some sort of calculations but the balance between the amount of input and output variables is better. An example here might be a mortgage calculator.
Business Processes
This third and final category is the one that was the most invisible to us when we started our research. But it is incredibly common, and most of us recognize these types of spreadsheets when we hear about them. These are business processes that are run partially or entirely on spreadsheets.
A simple example might be a workplace lunch-order: Fill in the spreadsheet before 11:30 and the order will go out.
A higher level example might be that every department in the organization has to fill in a spreadsheet template and submit it to HR or Finance before the end of the month. There some poor back-office person aggregates the data into another spreadsheet, enters the results into the payroll system and sends it on to whoever creates the slide-deck for the upcoming board meeting.
And everything between: I’ve seen a spreadsheet that serves as the UI for a large IT company’s billing process. I’ve seen spreadsheets that generate custom portfolio reports for high net-worth individuals in a bank. I’ve seen spreadsheets that are effectively sophisticated CRM-systems.
These spreadsheets are usually accompanied by formalized or not-so-formalized workflows that rely on emailing spreadsheets around, notifying people of changes in a network drive or multiple people working on a spreadsheet stored in the cloud at the same time.
Somewhat tongue-in-cheek, I’ve theorized that every new process within an organization starts out as a spreadsheet before it is (sometimes) formalized in a purpose-built system. That formalization often comes at a great cost, and surprisingly often leads to a solution that is not only much more reliant on IT for operating and maintaining, but also a lot less flexible than the original spreadsheet creation.
Millions upon millions of dollars are spent on reprogramming workflows and processes that exist in spreadsheets into more formal systems, often only to see a roll-back to the spreadsheet system not too much later.
The reason: The spreadsheet systems are written and maintained by the domain experts — the business users that intrinsically understand the problem space. The more formalized IT systems are written by IT experts that have limited understanding of the problem space. Even when the domain expert and the IT expert work together on a new solution there is a lack of a common language and too much of a gap in the fundamental understanding of the problem for such a project to be successful.
But more about that later…
This article has also been published on Medium.
Written by Hjalmar Gislason.