Turn Airtable bases into stunning reports & analysis.

GRID is the fastest way to create professional-level data visualizations from your Airtable bases ✨

Start for free

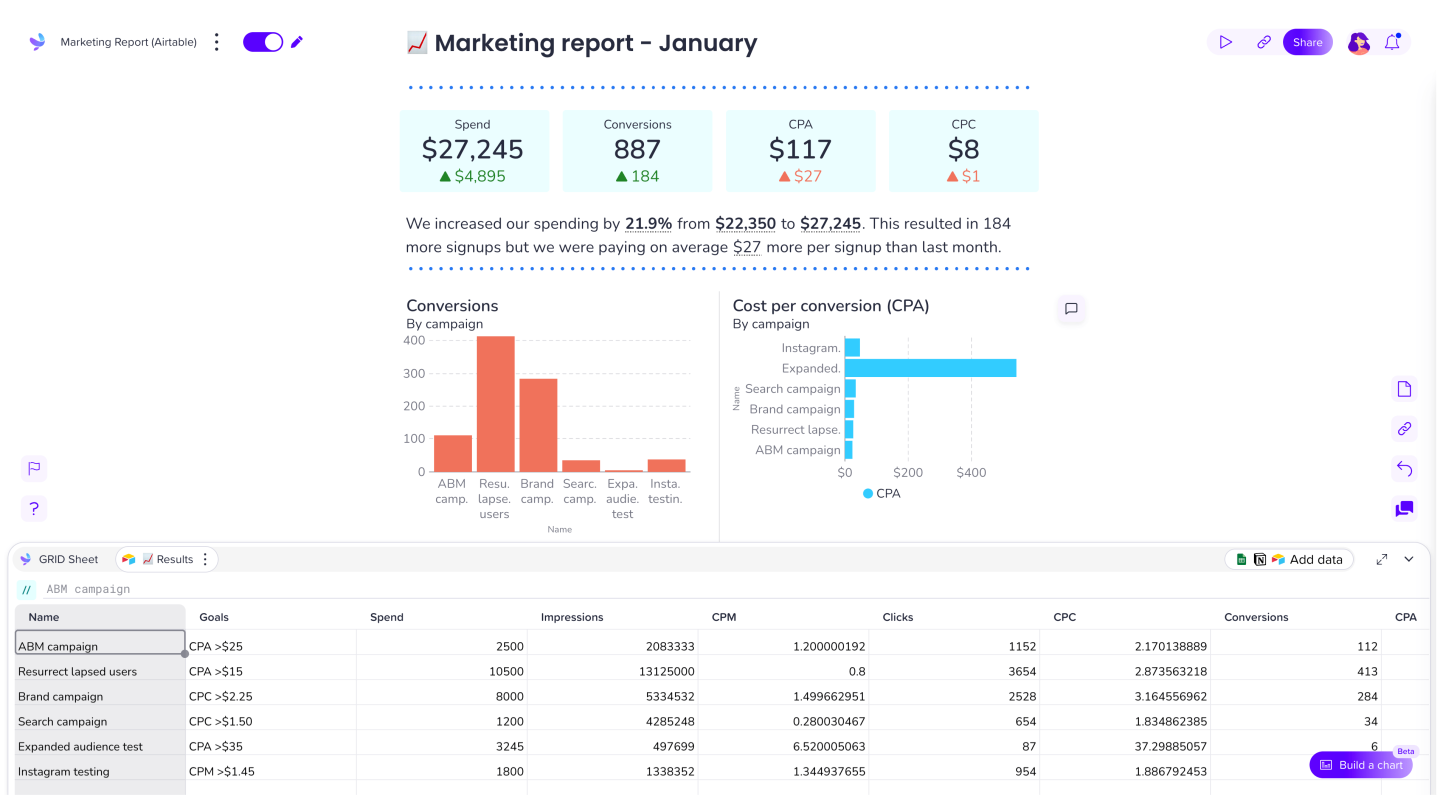
The fastest way to visualize Airtable bases

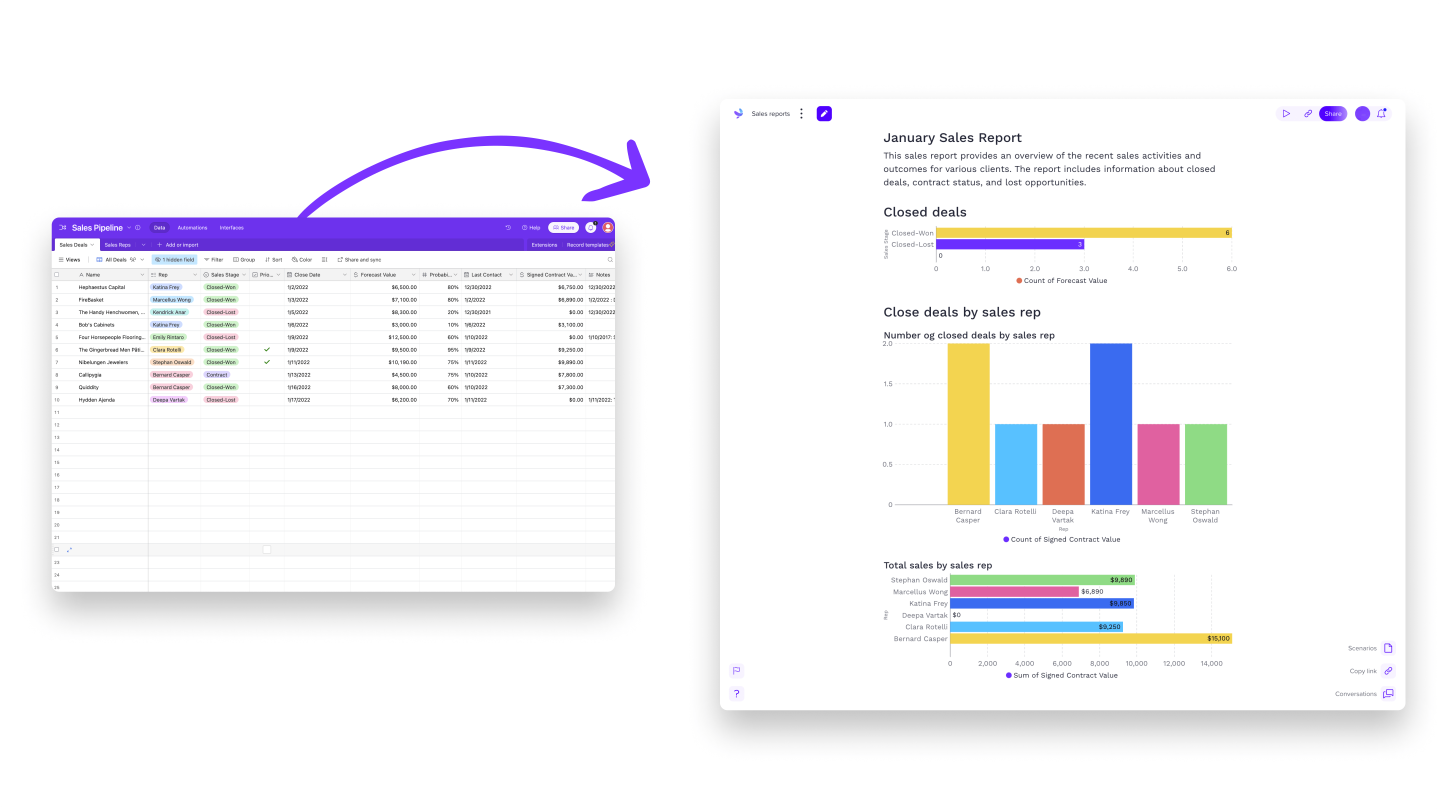
GRID helps you quickly surface important insights hidden in your Airtable bases and present more meaningful data.

✅ No code needed
✅ Simple to connect & combine data
✅ Charts update instantly
✅ Easy to share & embed

Airtable Marketing Report

GRID Smart Charts for Airtable ✨

airtable chart assistant 2

Get chart-building help from these game-changing features:

  • Chart Builder is a friendlier way to summarize, filter, split, and aggregate your data.

  • Our AI Chart Assistant lets you describe the chart you need and visualizes it for you!

Connect & combine your data

Connect your Airtable base to GRID – it’s super quick. Combine it with data from other sources like GRID Sheets, Notion, Smartsheet, Excel, or Google Sheets. Now you’re on your way to creating beautiful, interactive charts everyone can explore and understand.

Airtable - Data modal

Update charts & graphs instantly

Airtable bases to report

Your base is synced with GRID, so anytime you need to adjust or update it, you’ll see those changes instantly reflected in your charts, graphs and calculators.

Create gorgeous charts that are easy to interpret. Build interactive calculators that get your team engaged with important numbers. Update everything – instantly.

Frequently asked questions

Get GRID & visualize your Airtable bases

By proceeding to create your account and use GRID, you are agreeing to our terms of service and privacy policy.